
To set up synthetic monitoring in New Relic, follow these general steps:
- Access New Relic Dashboard: Log in to your New Relic account.
- Navigate to Synthetics: Go to the Synthetics section of your New Relic dashboard.
- Create a Monitor: Click on the option to create a new monitor.
- Select Monitor Type: Choose the type of monitor you want to create. New Relic offers options like simple ping monitors, scripted browser monitors, and API tests.
- Configure Monitor Settings: Fill in the necessary details such as the URL to monitor, frequency of checks, location from which to run the checks, etc.
- Set Alert Conditions: Define conditions that should trigger alerts (e.g., response time exceeding a certain threshold, content validation failures).
- Save and Activate: Once you've configured the monitor and alert conditions, save your settings and activate the monitor.
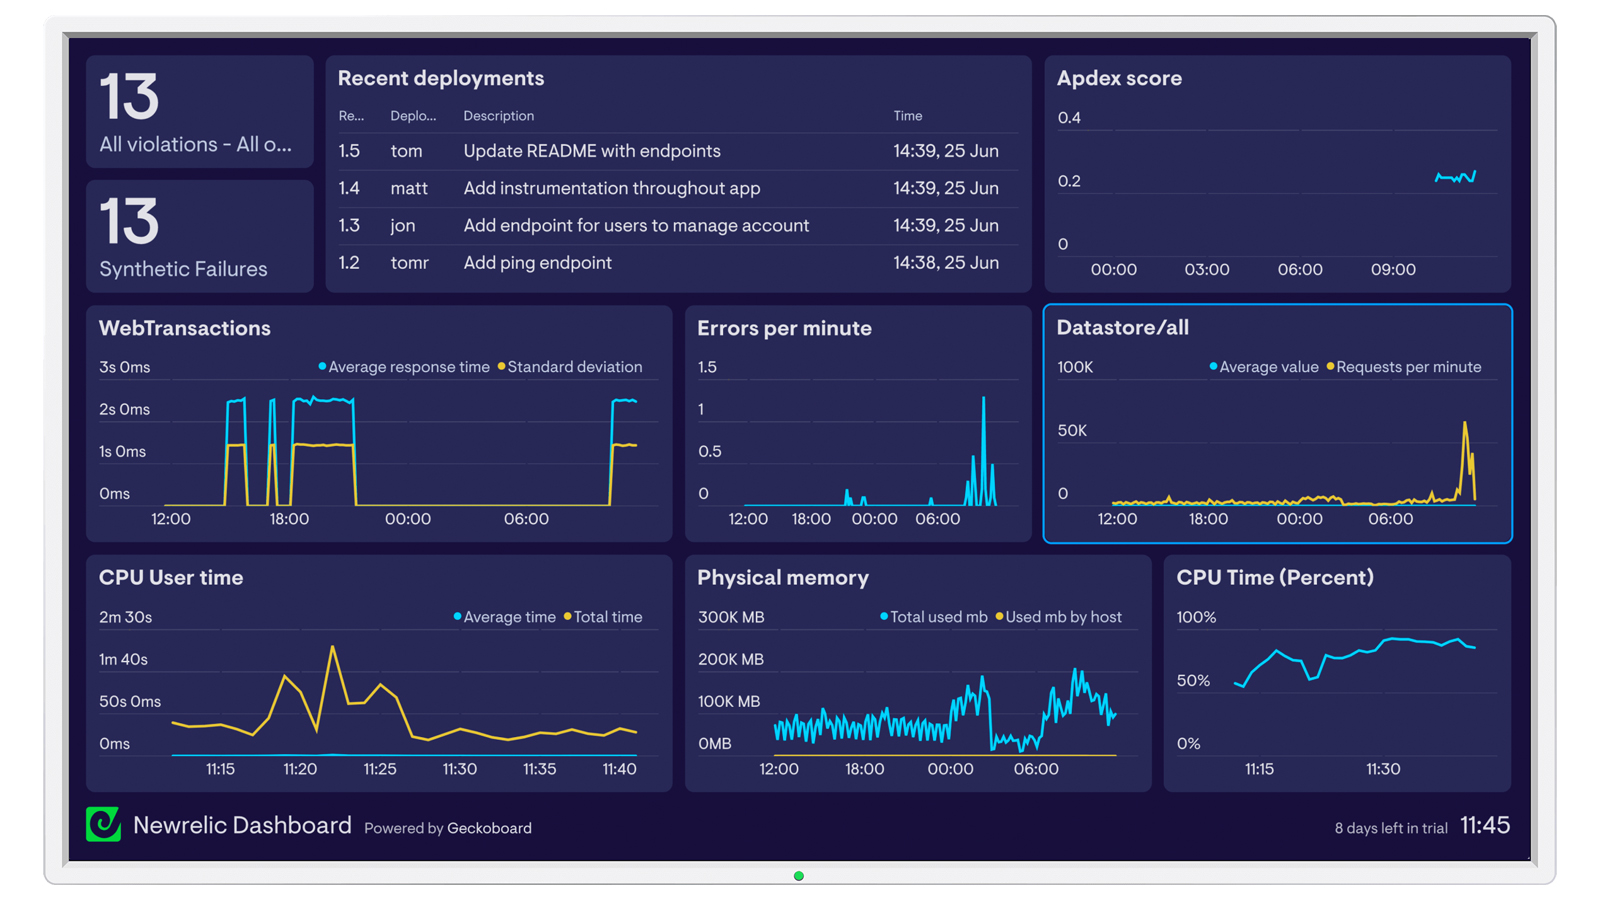
- Review Results: After the monitor has been running for some time, review the results in the New Relic dashboard. You can analyze performance metrics, view historical data, and troubleshoot any issues that arise.
- Adjust Settings as Needed: Periodically review and adjust your monitor settings and alert conditions based on your monitoring needs and any changes in your application or infrastructure.
New Relic provides detailed documentation and tutorials to guide you through the setup process for synthetic monitoring, tailored to the specific features and capabilities of their platform. Make sure to refer to their official documentation for the most accurate and up-to-date instructions.